

A creator dashboard can display thousands of numbers and still leave a campaign team unsure what to do. Useful measurement begins by connecting each metric to a decision. Reach helps estimate distribution. Retention shows whether the content held attention. Saves and shares suggest future value. Clicks and conversions show action. None of those signals should be interpreted without platform and distribution context.
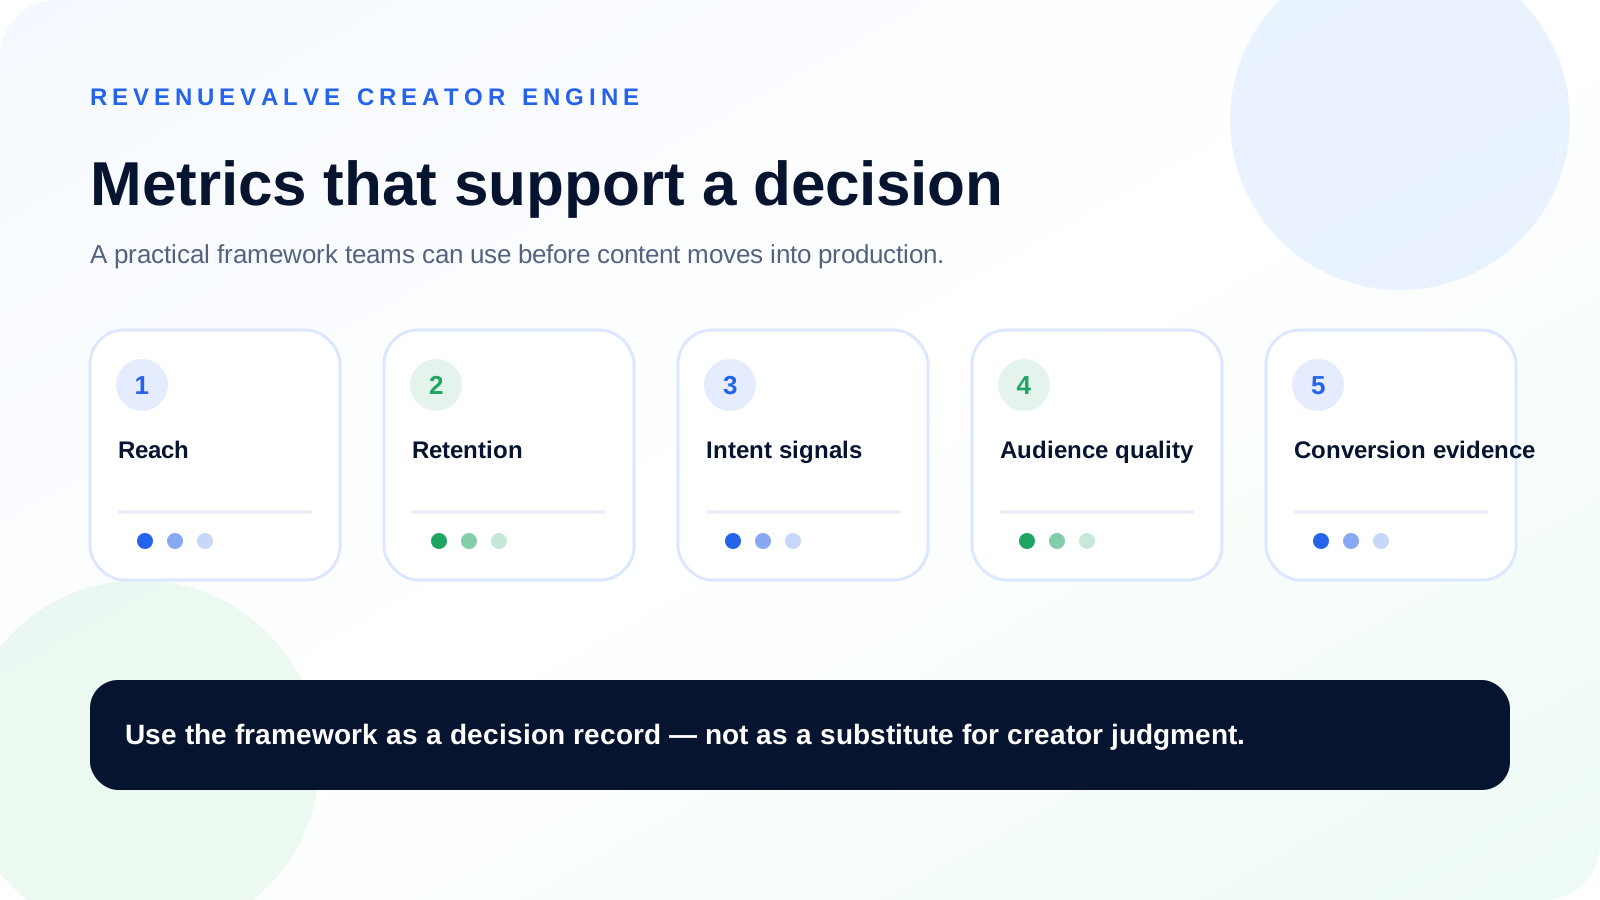
Give every metric a job
Distribution metrics
Reach, unique viewers, impressions, and views describe exposure. They do not tell you whether the audience understood the offer or cared. Use distribution metrics to answer: Did enough of the right people have a chance to see the content?
Attention metrics
Watch time, average view duration, retention, completion rate, and replays describe how long people stayed. YouTube explicitly separates reach and engagement reporting and notes that engagement metrics are validated and may adjust as systems confirm legitimate activity. Similar caution applies across platforms: dashboard numbers can update, lag, or be counted differently.
Intent signals
Saves, shares, meaningful comments, profile visits, product-page visits, and direct messages can indicate that the viewer wants to return, tell someone, or learn more. These signals are especially valuable for educational, high-consideration, or local campaigns where the purchase may not happen immediately.
Business outcomes
Revenue, purchases, leads, sign-ups, qualified sessions, store visits, and booked calls connect content with the campaign objective. Attribution is imperfect, so combine platform reporting with website analytics, codes, landing pages, and CRM data.
Respect the context of each platform
Instagram campaigns often combine Reels, Stories, feed posts, profiles, direct messages, and paid partnership distribution. Review reach and plays alongside saves, shares, profile activity, story interactions, and link behavior where available. A beautiful Reel with high plays may be useful for awareness, while a smaller Story sequence may create more direct response.
TikTok
TikTok content can spread beyond the creator’s follower base, so follower count is an incomplete forecast. Review video views, watch behavior, completion, shares, comments, profile actions, and the performance of multiple posts. Commercial posts should use the content disclosure setting when required; TikTok states that turning on the disclosure does not affect distribution in feeds.
YouTube
YouTube provides a useful separation between reach, engagement, audience, and revenue. For long-form video, impressions click-through rate, average view duration, watch time, and retention can explain why a video accumulated views. For Shorts, review engaged viewing and audience behavior rather than comparing the raw view count directly with long-form video.
X
X is often conversation- and link-oriented. Look at impressions in combination with replies, reposts, bookmarks where available, profile visits, link clicks, and the quality of discussion. A post that starts a relevant conversation may create more brand value than a larger post filled with unrelated reactions.
Normalize comparisons without erasing differences
Do not put every creator into one spreadsheet, divide total interactions by followers, and treat the result as universal truth. Use comparable windows, content types, and objectives.
- Separate organic posts from paid-supported posts.
- Separate typical performance from the top viral post.
- Use medians when one outlier distorts an average.
- Compare Reels with Reels, Shorts with Shorts, and Stories with Stories.
- Record post age; a seven-day post and a ninety-day post have different opportunities to accumulate views.
- Label estimated, creator-reported, platform-reported, and independently tracked data.
| Decision | Primary metric | Supporting context |
|---|---|---|
| Choose a creator | Typical qualified reach | Content fit, audience questions, sponsored-post quality |
| Choose a hook | Early retention | Thumb-stop rate, comments, audience segment |
| Scale paid media | CPA or conversion value | CTR, hold rate, fatigue, landing-page conversion |
| Renew a creator | Incremental business value | Production quality, audience trust, operational reliability |
Audience quality is a pattern, not one score
Review geography, language, age ranges, returning viewers, follower growth pattern, and category relevance where authorized data is available. Then compare those signals with public behavior. Do the comments match the audience the dashboard describes? Is the creator repeatedly attracting people who care about the topic?
Large spikes deserve explanation. They may come from a relevant viral post, a giveaway, paid promotion, a repost, or a topic outside the creator’s normal niche. None of those automatically makes the audience bad, but the campaign team should understand what created the number.
Engagement rate needs a denominator and a definition
An engagement rate based on followers answers a different question from engagement divided by reach or views. The included interactions also vary: likes and comments, or likes, comments, shares, saves, and clicks. Always display the formula and source.
Use engagement rate to compare similar content in similar circumstances. It is less useful as a single cross-platform ranking number.
Connect creator content to business results
Use multiple attribution methods when possible. UTM parameters identify sessions from specific links. Creator codes capture some purchases but may be shared outside the original post. Platform pixels and conversion APIs help paid campaigns. Post-purchase surveys can identify influence that last-click tracking misses. CRM records connect leads and booked calls with campaigns.
Measure the landing page too. A creator may send qualified traffic to a page that loads slowly, hides the offer, or performs poorly on mobile. Creative and conversion experience should be reviewed together.
Creative-level reporting creates better decisions
Tag each asset by creator, concept, hook, product proof, CTA, length, and format. Over time, the brand can learn whether demonstrations outperform testimonials, whether a specific objection produces stronger clicks, or whether a creator’s voiceover assets scale better than talking-head content.
This is more useful than a monthly slide that says the campaign generated “millions of impressions.” The campaign team needs to know what to make next.
A reporting structure executives and creators can use
- Objective: One sentence describing the business job.
- Distribution: Qualified reach, views, frequency, and audience context.
- Attention: Watch time, retention, completion, and hook performance.
- Intent: Saves, shares, comments, profile activity, and clicks.
- Outcome: Leads, sales, bookings, cost, and conversion value.
- Creative learning: The strongest and weakest concepts with reasons.
- Next action: What to scale, revise, stop, or produce.
Creators should receive useful feedback, not only a final score. Share which moments held attention, which questions appeared, and how the content was used. Better feedback improves the next production cycle and makes the relationship more valuable.
Sources and further reading
- YouTube: Get started with YouTube Analytics
- YouTube: How engagement metrics are counted
- YouTube: Understand engagement
- Google Analytics documentation
- TikTok: Content disclosure and partnership analytics
Metric availability varies by account, permission, location, content type, and platform changes.